Research Methods
- Stakeholder Interviews
- User Research
- Problem Statement
- Persona
- Empathy Map
- Journey Map
- Affinity Map
Tools Used
- Figma
- Mural
- Google Suite
- Zoom
Deliverables
- UX Presentation
Team Size
6 people

Addressing the Decline of Bees in Wisconsin
Empathise — Recognizing the Crisis
Imagine Wisconsin’s fields and gardens in full bloom, but with a critical element missing—the hum of bees. Pollinators like honey bees, which pollinate 80% of all flowering plants, are dwindling, their populations hit hard by a combination of habitat loss, pesticide use, and climate change. The decline of bees, particularly bumble bees with a shocking 90% decrease since 2000, risks not only local ecosystems but also Wisconsin’s agricultural stability.
80%
of all flowering plants are pollinated by Honey bees alone
90%
Decline in Bumble Bees since 2000
$577 bn
worth of annual global food production relies on their contribution.
My Goal
As a human-centered designer, I aimed to dig deep and understand the issue fully, using research and interviews to gather real insights. My goal was to share clear, impactful findings that could inspire both stakeholders and the community to take meaningful action.
My Role
In my role as a UX Researcher, I connected directly with beekeepers, environmentalists, and researchers—to uncover the real issues. I focused on finding solutions grounded in empathy and a true understanding of their challenges.
User Research — Deepening Our Understanding
Through qualitative user research, I engaged with a range of individuals, from hobbyist beekeepers to large-scale commercialists and environmental non-profits. These conversations revealed the challenges each group faced, including disease threats, pesticide exposure, and the impacts of harsh winters. This research laid the foundation for our empathy-centered design decisions.
user research findings
During our qualitative research, we interviewed beekeepers, entomologists, and researchers at the Wisconsin Beekeepers Conference.
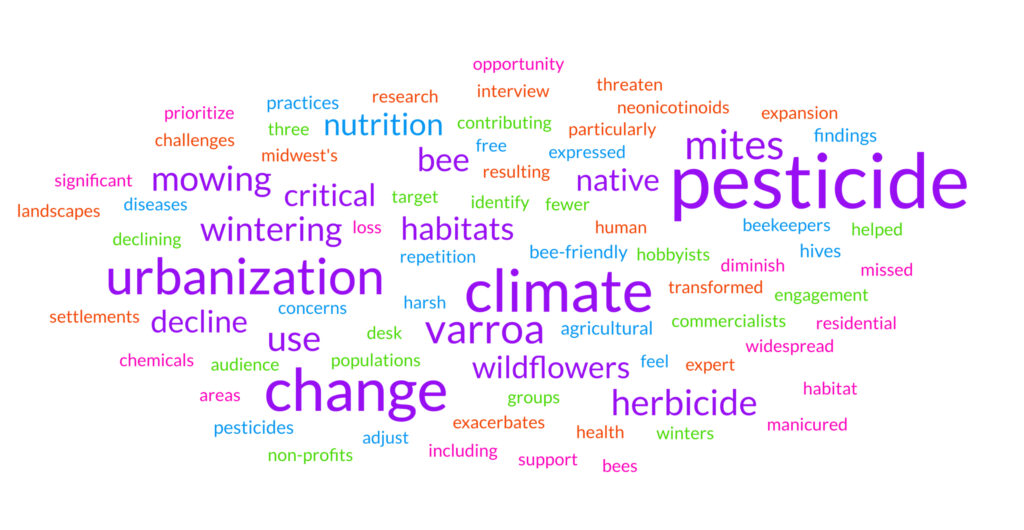
Key Insights – Beekeepers raised concerns about diseases, pesticides, Varroa mites, and harsh winters affecting bee populations. We identified three key audience groups: hobbyists (under 50 hives), commercialists (50+ hives), and non-profits.
Three target audience groups identified: Hobbyists (fewer than 50 hives), Commercialists (50+ hives), and non-profits.
desk research findings
1. Urbanization and agriculture in the Midwest have drastically reduced native habitats and wildflowers, both of which are essential for bee nutrition.
2. The use of herbicides and pesticides, especially neonicotinoids, further endangers bee populations, threatening pollination and biodiversity.
3. Climate change and intensive farming practices are major contributors to habitat loss, highlighting an urgent need for sustainable land management and regenerative agriculture.
expert interview findings
Habitat loss from agricultural practices and chemicals, including widespread herbicide use in residential areas and mowing practices, further diminish bee-friendly habitats. There is a significant missed opportunity to support bees as many prioritize manicured lawns over creating bee-friendly environments.
Define — Framing the Problem
Bee populations in Wisconsin are declining due to habitat loss, pesticide use, climate change and a lack of community awareness about their importance. This decline threatens ecosystems, agriculture, and food security in the region.
Empathy Mapping
We created Empathy maps to help us visualize user attitudes and behaviors, aligning everyone on a deep understanding of our end users.
Affinity Map - Finding Patterns
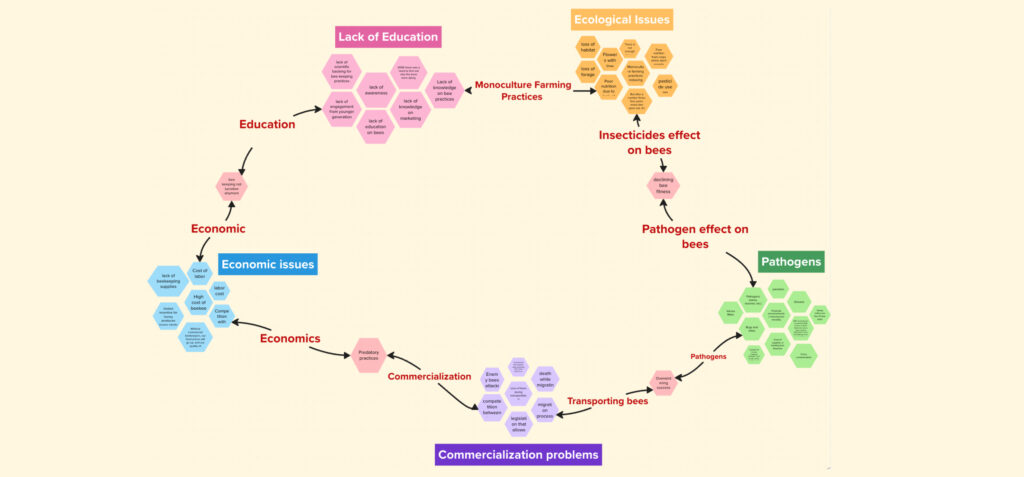
We created affinity maps to organize research findings, identify patterns, and clarify systems. This helps us understand user needs, prioritize issues, and guide design decisions effectively.
key factors affecting the Wisconsin Bees:
(1) Loss of habitat (2) Agricultural Intensification
(3) Pathogens (4) Climate Change
User Journey Map - Seeing the Story from the User’s Eyes
To align the team’s understanding, I created a user journey map that visualized the experiences, emotions, and challenges faced by our user groups.
This journey map uncovered points of friction and highlighted opportunities to support and educate beekeepers, hobbyists, and conservation advocates. It kept our design focused on actual user pain points, driving our mission to create solutions that resonate with the community.
Summary of My Key Contributions
Research and Engagement: Conducted deep user research, uncovering crucial insights from stakeholders and field experts.
Data Synthesis: Utilized affinity and journey mapping to clarify user needs, highlight issues, and align the team’s vision.
Solution Design: Led ideation sessions that produced life-centered solutions, balancing ecological sustainability with human needs.


